Google AI Mode Introduces Advanced Data Visualization for Finance Queries
New AI Mode Features for Financial Data Analysis
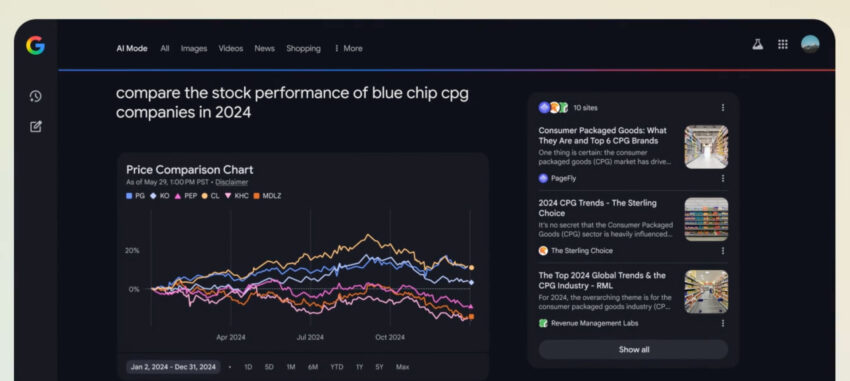
Google’s AI Mode now includes the ability to analyze complex financial datasets and generate dynamic charts and graphs. This enhancement specifically targets finance-related queries such as stocks and mutual funds, enabling users to:
- Compare stock performance across companies
- View price history over specified time periods
- Ask follow-up questions like dividend payments
Powered by Gemini’s advanced multi-step reasoning and multimodal capabilities, AI Mode automates data research and visualization, simplifying financial analysis.
User Experience and Industry Insights
According to Google’s User Experience Research (UXR) team, users increasingly rely on AI for exploratory advice, how-to guides, and localized shopping assistance. The rollout of AI Mode’s data visualization features reflects these user priorities, aiming to deliver insightful and interactive responses.
Getting Started with Google AI Mode Data Visualizations
- The new features are currently available in Labs and focus on stock and mutual fund queries.
- Users can initiate queries like “compare the stock performance of blue chip CPG companies in 2024” and follow up seamlessly.
- Google encourages feedback to refine and improve the capabilities.
Source: Search Engine Roundtable by barry@rustybrick.com (Barry Schwartz). Read original.