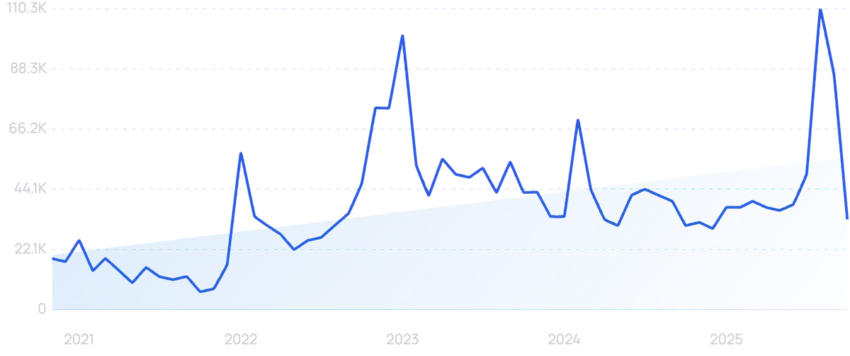
TL;DR Summary of How to Use Data Storytelling to Boost Content Visibility and Engagement
Optimixed’s Overview: Elevate Your Content Strategy with Effective Data Storytelling Techniques
Understanding the Power of Data Storytelling
Content marketers face increasing challenges in standing out online, especially with AI-generated summaries dominating search results. Data storytelling offers a solution by transforming raw data into meaningful stories using visuals and narratives. This approach enhances comprehension, drives engagement, and boosts rankings across both traditional SEO and AI-powered platforms.
Key Steps to Craft a Compelling Data Story
- Define Your Audience and Thesis: Identify who needs the information and the central question your story will answer to ensure relevance and clarity.
- Source and Prepare Data: Use original surveys, correlational studies, APIs, or public datasets to collect reliable information that supports your thesis.
- Select Appropriate Visuals: Match chart types—bar charts, line charts, scatter plots, pie charts—to the story you want to tell for maximum clarity and impact.
- Visualize and Format Your Story: Choose formats such as infographics, dashboards, scrollytelling, slide decks, videos, or long-form articles based on your audience’s preferences and the story’s complexity.
Effective Formats to Share Your Data Story
- Infographics: Great for standalone, shareable insights with bold headlines and minimal but clear visuals.
- Dashboards: Ideal for real-time data monitoring and user interaction with filters and KPIs tailored to stakeholders.
- Scrollytelling: Provides an immersive, step-by-step narrative with animated visuals to engage users deeply.
- Slide Decks: Useful in presentations to control pacing and add verbal context to data points.
- Video Overviews: Combines audio and visuals to make complex data accessible to broader audiences.
- Long-Form Articles: Integrate detailed context, analysis, and data visualizations for readers seeking in-depth understanding.
Writing and Presenting Your Data Story
Successful data storytelling requires clear headlines that communicate the main findings upfront. Use annotations on visuals to highlight key data points and provide essential context such as timeframes and definitions. Include commentary that interprets the data, drawing actionable insights rather than simply reporting facts. Finally, end with a strong call-to-action that guides readers on what steps to take based on the story’s conclusions.
Why Invest in Data Storytelling?
While data storytelling demands more time and effort than typical content, it yields substantial rewards: higher engagement, improved SEO performance, and greater influence over decision-making audiences. It bridges the gap between raw metrics and meaningful business impact, turning numbers into narratives that inspire action.
Start by exploring reliable data sources and choose the format that best fits your audience and message. With thoughtful execution, your data stories will not only capture attention but also drive strategic decisions and growth.
